Introduction
Diabetes is a disease caused by absolute or relative deficiency of insulin, and its typical symptoms include frequent urination, polyuria (excessive urination), thirst, fatigue, and weight loss. In addition, complications such as coronary artery disease, cerebral artery disease, peripheral artery disease, retinopathy, nephropathy, and diabetic neuropathy are very serious diseases that can be health hazard factors, including death, to diabetic patients.
The most common form of diabetes is Type 2 diabetes, characterized by abnormal insulin secretion in pancreatic tissue and hyperglycemia by ‘insulin resistance’ in insulin target tissue. Data from the American Diabetes Association (ADA) shows that as of 2019, 37.3 million, or 11.3% of the total U.S. population, are diabetic patients, of which more than 90% are type 2 diabetes [1]. In particular, according to the Centers for Disease Control and Prevention’s National Diabetes Statistics Report, the number of diabetes patients has been steadily increasing from 1999 to 2016 [2].
According to ADA’s announcement in 2018, the cost of diabetes treatment has increased by 26% over a five-year period from $245 bill in 2012 to $327 bill in 2017, becoming a global socio-economic burden [3], epidemiological variables and measurement values such as FBS, Glc2Hr, and HbA1c used to diagnose diabetes mainly differ after the 40s when the disease prevalence rapidly increases, so they can be used for short-term changes, but it is difficult to select them early and prevent diseases. Prediction of diabetes based on genetic mutations has also been suggested through several previous studies, but low predictive rates and statistical explanatory power are becoming problems. A number of T2D-related genetic variants identified by GWAS have also been reported in recent studies, but a method that can provide prediction accuracy and give an insight into the onset timing based on individual genomes based on actual cohort data is needed.
Accordingly, ichrogene evaluates the polygenic risk of ichrogene selected markers for the diagnosis of T2D high-risk group and presents ‘T2D precision health report’ that provides insights such as likelihood of development and predicted age of onset through population genome and epidemiological big data.
Methods
Study Population and GWAS
Among the East Asian study population, history of disease and medication that could have a clinical impact were excluded, and T2D patients and normal groups were defined as follows according to the criteria presented by the American Diabetes Association (ADA).
T2D Case: FPG >= 126 mg/dL (7.0 mmol/L), 2-hour blood glucose >= 200 mg/dL (11.1 mmol/L) after oral glucose tolerance test (OGTT), or HbA1c >= 6.5% (48 mmol/L) mol). Including cases diagnosed with type 2 diabetes according to other history information.
Control: FPG < 100 mg/dL (5.6 mmol/L), OGTT < 140 mg/dL (7.8 mmol/L), or HbA1c < 6% (48 mmol/mol). All persons must not have been diagnosed with type 2 diabetes.
We first adopted 176 genetic markers known as T2D variants in previous reports [4]. Subsequently, logistic regression according to genetic variation information, age, gender, and cohort region was performed to analyze the association with type 2 diabetes, and the presence or absence of effect alleles was confirmed.
Polygenic risk score (PRS) is a genetic score developed based on the notion that multiple genetic mutations affect disease development [5]. Through PRS, various genetic variations can be taken into account to express the individual's genetically vulnerable disease or related characteristics as a score, which can be used for prevention with early detection. For most common diseases and characteristics, polygenic inheritance, which includes many common genetic mutations with small effects, plays a larger role than rare single genetic mutations [6-8]. We calculated PRS to confirm the association between 176 genetic markers and T2D.
PRS Calculation Method
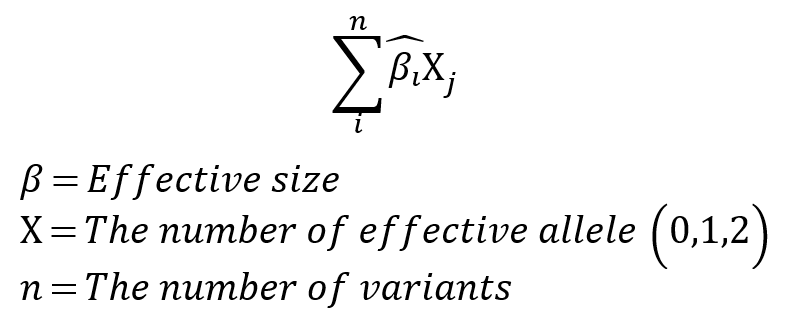
The PRS calculation method applies the effect size (or beta) of n mutations as a regression coefficient and the effective allele of the mutation as an additive model, the number of effect alleles (0,1,2) is multiplied by the regression coefficient and then added together [9]. Model fitting was performed for the training group using the selected variants and covariates as features, and T2D PRS was calculated for all data using this fitted model.
Risk Calculation by ichrogene algorithm
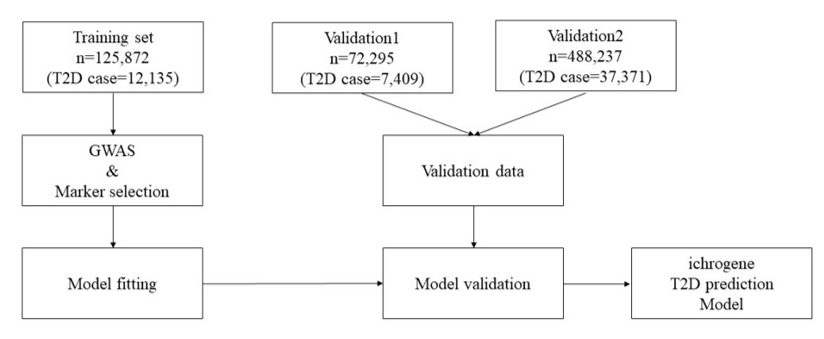
Figure 1. Diagram of ichrogene T2D prediction PRS model.
In order to calculate PRS from selected T2D genetic markers, we needed to impute missing genotypes for all datasets. For this purpose, we first applied phasing using Shapeit4 (ver 4.2), 1KGP datasets being used as template, and imputation using minimac4 (ver1.0,3). Among study population with genotype imputation, for 176 T2D genetic markers, 0 was assigned when the effect allele was absent, 1 when only one haploid was present, and 2 when both haploids were present. When a genotype is confirmed using genotype imputation, it has a real number value between 0 and 2 according to the posterior probability of the effect allele. The beta coefficient (β) at each locus is calculated by comparing the effect allele frequency of each polymorphic marker locus in patients with type 2 diabetes with the effect allele frequency in normal controls. The PRS calculated from this is normalized to have a standard normal distribution.
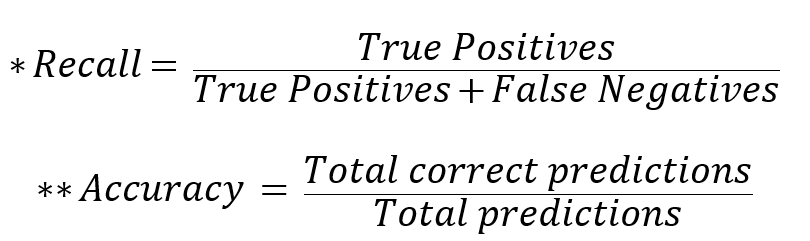
To proceed with the validation, the genetic high-risk group calculated by the PRS score in the dataset not used for PRS model fitting was compared with the prevalence of type 2 diabetes in the median (40-60%) group and low-risk group, and *Recall and **Accuracy were calculated to confirm the performance of the predictions. Recall is a way to determine how well the actual Case is found through prediction, and when predicting disease and characteristics, a model with a high Recall value that can well detect the actual Case is suitable.
Results
Study Population and marker selection for T2D prediction
About 8.3 million SNP information was obtained through genetic information analysis on the training group, and 176 T2D-related markers, including well-known T2D markers rs7903146, rs539515, and rs3768321, were selected using this, and it was verified by ~70,000 East Asian cohort and ~480,000 European-centric cohort. The data used for verification is described in Table 1.
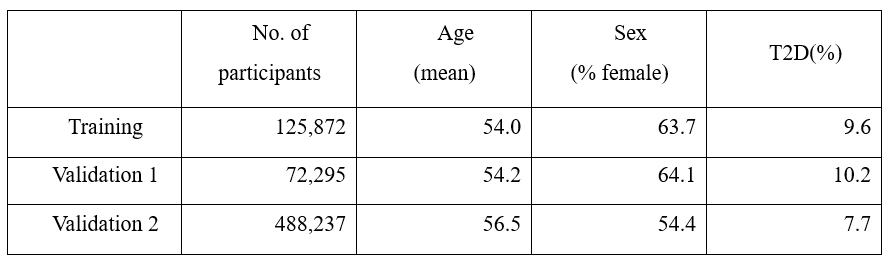
Table 1. Study & validation population demographic characteristics.
PRS distribution of T2D case and control
We checked the histogram of the distribution of T2D PRS scores from East Asians and Europeans that were not used for marker selection (Fig. 2). A significant amount of risk can be classified through stratification in the Case and Control groups located in the right tail of the histogram. In East Asian and European, we compared the prevalence of type 2 diabetes high risk (Top 1%, 5%, 10%, 20%) with the median (40-60%) and low-risk (Bottom 1%, 5%, 10%, 20%) and overall. As a result, when comparing the entire group with the high-risk 20% in East Asian, the ratio was about 1.84 times which is the lowest, and the ratio between the high-risk 5% group and the low-risk 5% group was about 8.67 times, and even the ratio of the high-risk 1% group and the low-risk 1% group was 18.21 times. In European, when comparing the entire group with the high-risk 20% group, the ratio was about 1.6 times which is the lowest, and the ratio between the high-risk 5% group and the low-risk 5% group was about 5 times higher. The difference between the high-risk 1% group and the low-risk 1% group was 8.12 times. (Tab. 2)
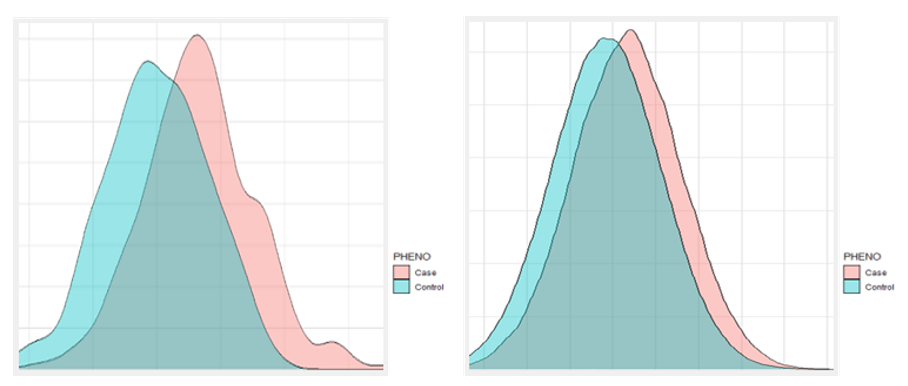
Figure 2. The histogram predicted by PRS; East Asians (left), Europeans (right).
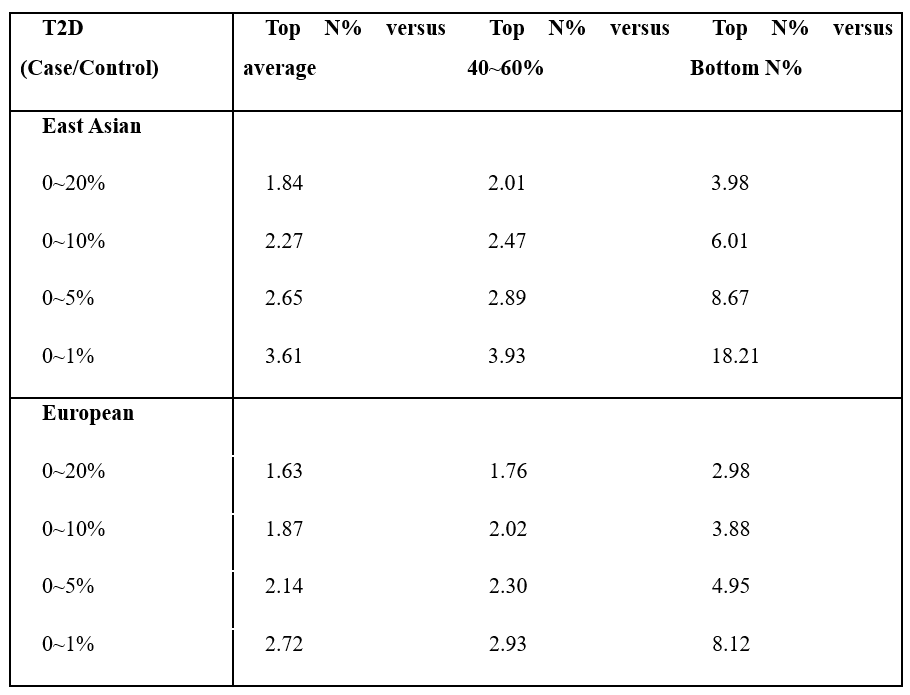
Table 2. The interval-specific Recall and Accuracy of type 2 diabetes.
Performance of Risk Calculation in Training and Validation
To check the performance of the analysis model, Recall and Accuracy were calculated. For East Asian, Recall was 0.930 for the top and bottom 1%, 0.873 for the top and bottom 5%, 0.833 for the top and bottom 10%, and 0.776 for the top and bottom 20%. For Europeans, Recall was 0.871 for the top and bottom 1%, 0.813 for the top and bottom 5%, 0.778 for the top and bottom 10%, and 0.732 for the top and bottom 20%. For East Asian, Accuracy was 0.635 for the top and bottom 1%, 0.599 for the top and bottom 5%, 0.582 for the top and bottom 10%, and 0.562 for the top and bottom 20%. For Europeans, Accuracy was 0.579 for the top and bottom 1%, 0.557 for the top and bottom 5%, 0.547 for the top and bottom 10%, and 0.538 for the top and bottom 20%. Through this, the model consisting of 176 markers showed a discriminating effect in East Asian and European, which shows that iSearchme's markers have sufficient ability to discriminate type 2 diabetes by PRS calculation alone. (Tab. 3)
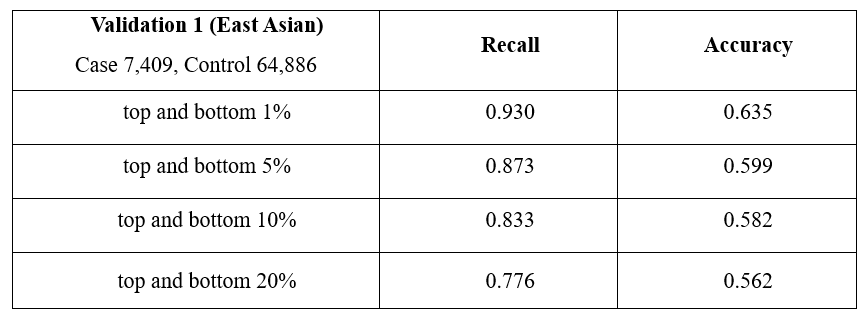
Table 3. Interval-specific Case Control ratio assessment
Prediction of onset age of T2D
For the cohort used to select markers, in order to compare the actual incidence of T2D disease and the calculated PRS value, we divided the PRS percentile into three parts (tertiles) into upper, middle, and lower values to confirm the incidence of T2D by age group (Fig. 3). Although the incidence of T2D also increases with age, the upper PRS group showed the highest prevalence across all age groups, both East Asian and European. This means that the possibility of disease onset can be predicted indirectly according to the PRS value calculated based on the user's genome information, and the incidence rate by age can be predicted based on actual cohort epidemiological data.
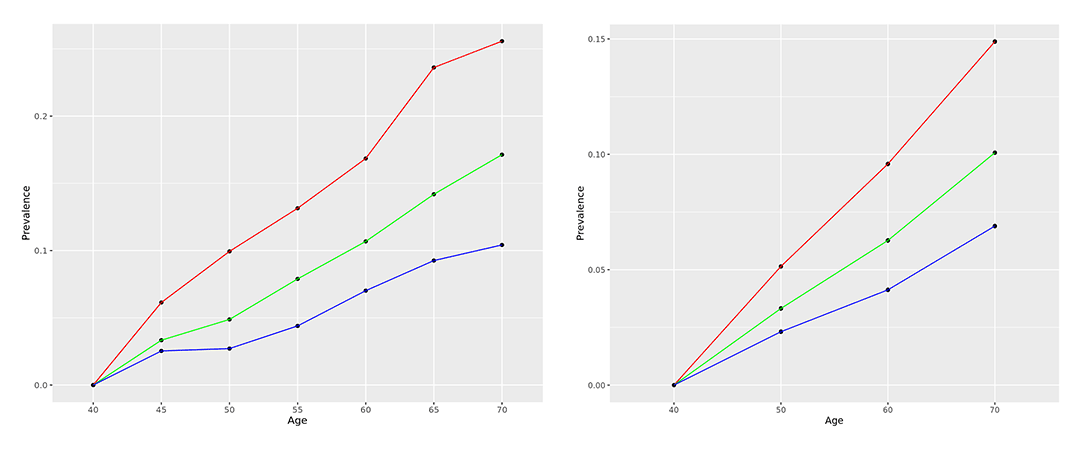
Figure 3. The age-specific prevalence T2D predicted by PRS (Red: High value, Green: Middle value, Blue: Low value); East Asians (left), European (right).
Discussion
In this report, we present a method to predict T2D according to genetic risk, and to provide information about its prediction accuracy and timing of onset. As a result of the prediction through the ichrogene model, Recall is maximum 0.93 and Accuracy is 0.635 in Training (EAS) and Recall is maximum 0.871 and Accuracy is 0.579 in Validation (European). The T2D high-risk group (PRS top 1%) is identified with high accuracy (Tab. 3). However, some claim that PRS results are just predictive values and are not suitable for use in clinical diagnosis [10], which limits the application of PRS-based treatments and interventions. Nevertheless, MI-GENES study has shown the effects of reducing LDL-cholesterol by disclosing the genetic risk of CAD through the PRS, and there was also a case of preventing overdiagnosis of prostate cancer through the prostate cancer PRS model [11], the T2D PRS model is also expected to be used for clinical diagnosis and disease prevention in the future. In particular, individuals who own the genome MyData check their "precise health reports" to enable preemptive health management such as diet, exercise, and life-style changes, and this effect has been proven through various studies [12, 13].
Our approaches to understand polygenic effects on T2D and related indications/phenotypes, also have areas that need to be improved in the future. As a result of studies on various population groups, it is known that the genetic risk of T2D is also related to the genetic risk of various phenotypes such as exercise, sleep hygiene, alcohol drinking, smoking, and dietary effects. The predictive accuracy of ichrogene's analysis model can be improved in the future through Gene-Environment interaction analysis including genetic variations related to the above-mentioned phenotypes.
In addition, high prediction accuracy was obtained by performing GWAS, marker selection, and accuracy verification in a cohort of about 650,000 people used as training and validation sets in this study. We believe that potential clinical usability will increase through continuous improvement of ichrogene's analysis model with new GWAS markers and lifestyle data from the reanalysis of genome-centric cohort big data that is growing for populations of various races around the world.
ichrogene has developed an analysis algorithm that calculates the genetic risk of the disease (T2D) with the time of onset and the risk of disease, from the user's point of view, and we are committed to continuously updating it. This 'Precision health report' is the first and best report in the market that provides predictive information on future health/disease status along with age-specific periods based on actual cohort big data.
References
1 "Statistics About Diabetes", American Diabetes Association, [Online]. Available: https://diabetes.org/about-us/statistics/about-diabetes.
2 "National Diabetes Statistics Report 2020 Estimates of Diabetes and Its Burden in the United States", Centers for Disease Control and Prevention, [Online]. Available: https://www.cdc.gov/diabetes/pdfs/data/statistics/national-diabetes-statistics-report.
4 "The Cost of Diabetes", American Diabetes Association, [Online]. Available: https://diabetes.org/about-us/statistics/cost-diabetes.
5 Kim B-J, Kim YJ, et al. "Methods for diagnosing the high risk group of diabetes based on genetic risk score", Patent No. KO102254341B1, Korean Intellectual Property Office, 2021.
6 International Schizophrenia Consortium, Purcell SM, Wray NR, et al. "Common polygenic variation contributes to risk of schizophrenia and bipolar disorder", in Nature, 2009.
7 Fisher RA, "The Correlation between relatives on the supposition of Mendelian inheritance", in the Royal Society of Edinburgh, 1918.
8 Gibson G, "Rare and common variants: twenty arguments", in Nature Reviews Genetics, 2012.
9 Golan D, Lander ES, Rosset S, "Measuring missing heritability: Inferring the contribution of common variants", in Proc Natl Acad Sci USA, 2014.
10 Dudbridge F, "Power and predictive accuracy of polygenic risk scores", in PLoS Genet, 2013.
11 Abu-El-Haija A, Reddi HV, Wand H, et al. "The clinical application of polygenic risk scores: A points to consider statement of the American College of Medical Genetics and Genomics (ACMG)", in Genet Med, 2023.
12 Lambert SA, Abraham G, Inouye M, "Towards clinical utility of polygenic risk scores", in Hum Mol Genet, 2019.
13 Mikkelsen B, Williams J, Rakovac I, et al. "Life course approach to prevention and control of non-communicable diseases", in BMJ, 2019.
14 "Preventing Type 2 Diabetes", National Institutes of Health, [Online]. Available: https://www.niddk.nih.gov/health-information/diabetes/overview/preventing-type-2-diabetes.